Copper at a Make-or-Break Zone: Breakout Rally or Sharp Rejection?
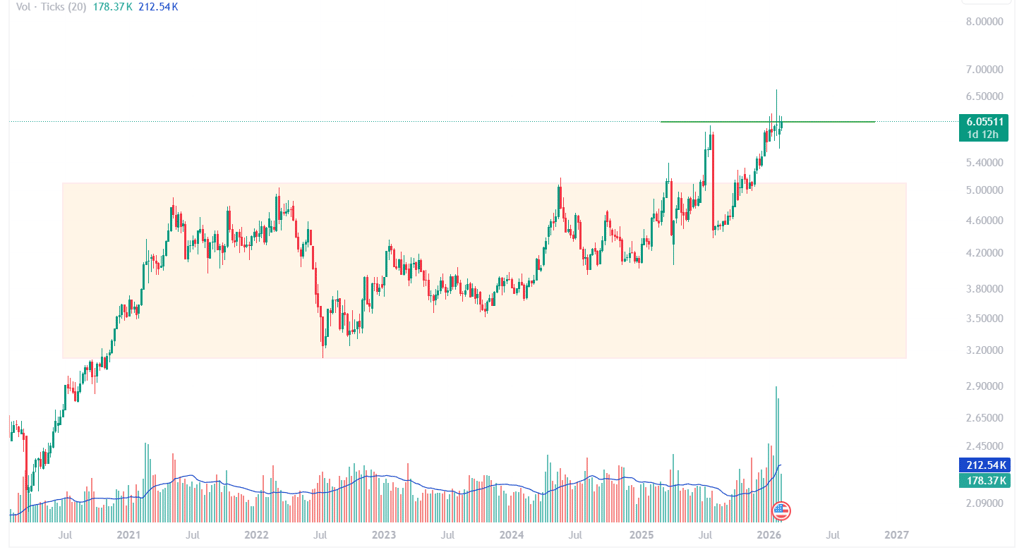
Copper — often called “Dr. Copper” for its ability to predict economic health — is now sitting right at a major long-term resistance zone. This isn’t just another price level. It’s an area where the market has historically struggled, and decisions made here could define the next big move. Right now, traders, investors, and even industrial buyers are watching closely. The metal is essentially asking the market a question: “Do we have the strength to break higher… or are we about to get pushed back down?” Let’s break it down.
FINANCE
Akshay Rawal
2/12/20262 min read
Why This Resistance Level Matters
On the higher timeframe, copper has returned to a price region that previously acted as a strong supply zone. In the past, this area triggered:
Heavy selling pressure
Trend reversals
Long consolidation phases
When price revisits such a zone, two forces collide:
Buyers (Bulls)Sellers (Bears)Expect global growth recoveryThink prices are overheatedBetting on infrastructure & EV demandExpect slowdown fears to returnSeeing higher highs formingWatching overbought conditions
This creates volatility compression before a large move.
Scenario 1: The Breakout
If copper closes strongly above resistance, especially with:
Expanding volume
Strong weekly candle bodies (not just wicks)
Follow-through buying in the next sessions
Then we’re likely seeing a structural breakout, not a fake one.
What that could mean:
Start of a new bullish leg
Funds rotating into commodities
Signals of confidence in global manufacturing & construction
Potential acceleration as short sellers get squeezed
Psychologically, once resistance flips to support, traders who waited on the sidelines rush in, fueling momentum.
Translation: Breakout = momentum + macro optimism.
Scenario 2: The Rejection (Collapse Setup)
If copper fails to hold above this level and forms:
Long upper wicks
Bearish engulfing candles
Sudden spike in volume followed by selling
That’s often a distribution signal — smart money offloading into retail buying.
What that could lead to:
Fast pullback to mid-range support
Possible retest of previous consolidation zones
Broader risk-off sentiment in commodities
Since many traders enter near breakouts, a failure here can trigger stop-loss cascades, making the drop sharp rather than slow.
Translation: Rejection = profit booking + risk reduction.
What Makes This Level So Critical
This isn’t just technical. Copper sits at the intersection of:
Construction demand
EV & renewable energy growth
Infrastructure spending
China’s industrial activity
Global interest rate expectations
So this resistance is both a chart barrier and an economic confidence test.
How Smart Traders Are Handling It
Instead of guessing, experienced traders:
✔ Wait for confirmation (break + hold)
✔ Watch volume behavior
✔ Avoid chasing inside the resistance zone
✔ Prepare for volatility spikes
This is not a “set and forget” area — it’s a decision zone.
The Bigger Picture
Markets often spend weeks building energy at such levels before choosing direction. The move that follows is usually:
Strong
Fast
Trend-defining
Copper isn’t drifting — it’s coiling.
Final Thought
Right now, copper is like a door being pushed from both sides.
If buyers kick it open → fresh bullish phase
If sellers slam it shut → sharp correction phase
Either way, this zone is unlikely to be quiet for long.
The market is loading… the breakout or breakdown will be loud.